
Engineering answer
Quick answer
There is no single voltage-sag percentage that every VFD can tolerate.
VFD voltage-sag tolerance is not one voltage percentage. It is a voltage-versus-duration ride-through envelope.
VFD voltage-sag tolerance is an operating envelope defined by voltage, duration, load, DC-link energy and process requirements.
The practical question is whether this VFD, at its actual load, can keep this process operating through a sag to a stated remaining voltage for a stated duration.
Sag Magnitude Alone Does Not Tell You Whether a VFD Will Trip
A voltage sag has two essential dimensions: how low the voltage falls and how long it stays there.
To avoid ambiguity, this article expresses sag magnitude as remaining voltage. For example, if a 400 V supply falls to 280 V:
280 V / 400 V = 70%
we call this a sag to 70% of nominal voltage. This means 70% remaining voltage: the voltage has decreased by 30%.
A VFD may survive a very deep, short-duration sag but trip during a shallower event that lasts longer. Voltage-sag immunity is therefore evaluated as a magnitude-duration envelope, not a single trip percentage. EPRI adjustable-speed-drive guidance documents this voltage-versus-duration approach and describes remaining voltage explicitly.1
There is no universal VFD voltage-sag threshold.
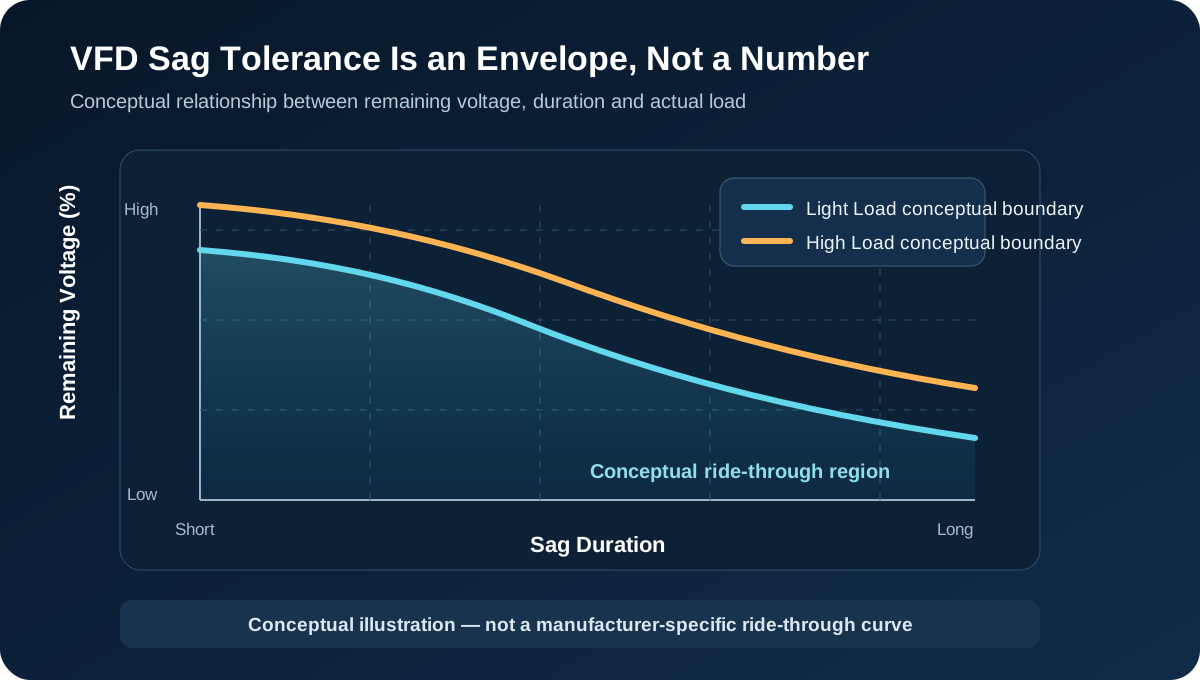
Figure 1. VFD sag tolerance is a voltage-versus-duration operating envelope. The high-load boundary is intentionally conceptual and indicates that higher load can reduce the ride-through envelope. Conceptual illustration — not a manufacturer-specific ride-through curve.
Why Higher Load Makes the Same VFD More Sensitive
When incoming AC power becomes insufficient, the VFD begins drawing energy from its DC link. The related sizing question is how much energy a VFD needs for voltage-sag ride-through. For the limiting case where useful input power temporarily disappears, capacitor-only ride-through time can be approximated by:
Plain-text formula: t_cap = C × (V_dc,0² - V_dc,min²) / (2 × P_load)
where:
- C = usable DC-link capacitance
- V_dc,0 = DC-bus voltage before the sag
- V_dc,min = minimum usable DC-bus voltage
- P_load = actual electrical load power
Use actual operating power, not just the VFD nameplate rating.
The denominator makes the load effect clear: as actual electrical load power rises, stored DC-link energy is consumed faster.
When incoming power is insufficient, a more heavily loaded VFD consumes the available DC-link energy faster.
The same VFD may survive a sag at light load and trip during the same event at high load. EPRI testing and guidance likewise treat loading as one of the variables needed to establish an adjustable-speed drive's ride-through envelope.1
Therefore, a 200 kW VFD operating at 80 kW should not be assumed to have the same sag tolerance as the same VFD operating close to 200 kW.
Are Larger VFDs More Sensitive to Voltage Sags?
Not automatically. A 300 kW drive is not inherently less tolerant than a 30 kW drive simply because it is larger.
The more meaningful parameter is usable DC-link energy relative to actual load power:
Usable DC-link energy per kW = E_cap / P_load
or usable DC-link energy per kW of actual load.
If usable DC-link energy does not increase in proportion to actual load power, capacitor-only ride-through becomes shorter. PG&E identifies the DC-bus capacitor as the principal electrical energy-storage element inside a conventional VFD and notes that built-in capacitance generally provides only a short period of full-load support.2
The engineering conclusion is:
Large or heavily loaded VFDs deserve particular attention when their usable DC-link energy is small relative to actual load power.
Manufacturer design, undervoltage threshold, rectifier topology and ride-through control strategy still matter.
One VFD and a Production Line Are Not the Same Problem
Consider a single VFD driving a ventilation fan. During a short sag:
Voltage sag → temporary speed reduction → voltage recovers → fan returns to speed
The process may tolerate this without interruption. Some drives can also use flying restart or kinetic ride-through, allowing a rotating load to slow temporarily and recover after voltage returns. PG&E notes that these approaches can work when the process can tolerate temporary reductions in speed or torque.2
Now consider a machine with several coordinated VFD-driven functions. During the same sag:
The drive-level failure mechanism is explained in why a VFD trips during a voltage sag.
- one drive may remain active;
- another may reach undervoltage;
- one motor may decelerate faster than another;
- a PLC or control power supply may reset;
- a contactor may drop out.
This creates two different engineering definitions.
VFD-level sag tolerance
Whether one individual VFD remains operational.
Process-level sag tolerance
Whether all critical functions remain sufficiently coordinated for production to continue.
A VFD can survive a voltage sag while the process it drives still fails.
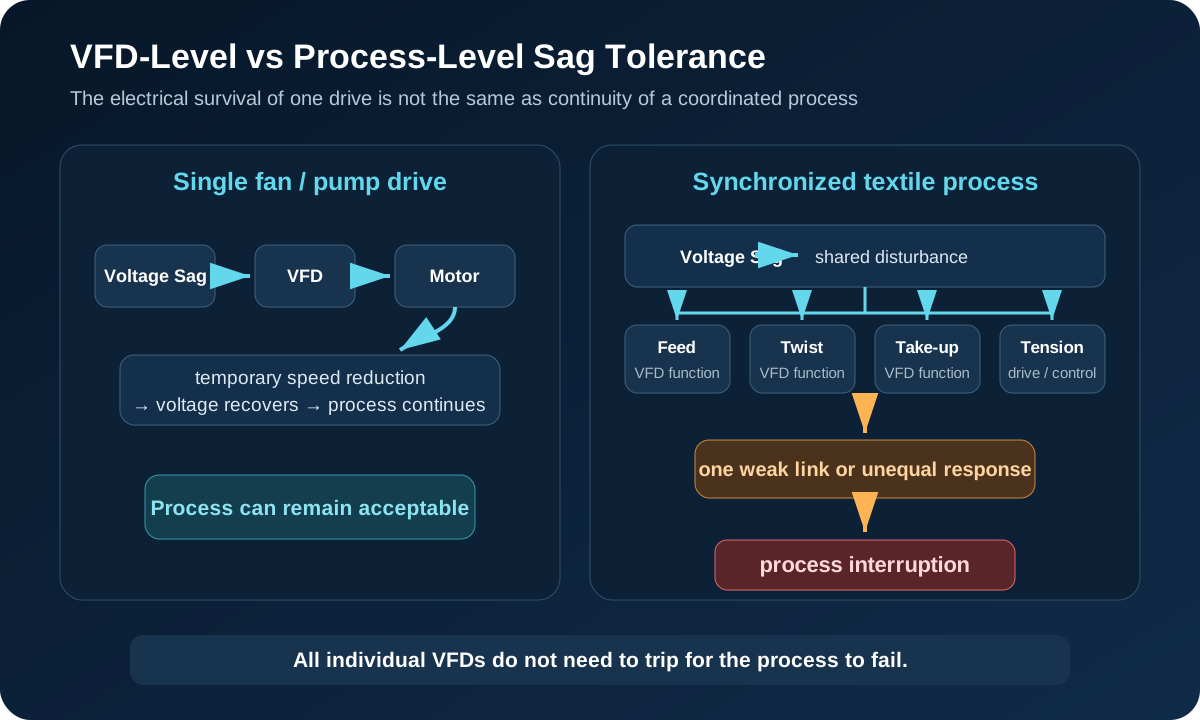
Figure 2. A stand-alone fan or pump may tolerate temporary speed reduction, while a synchronized textile process can stop when one critical function drops out or responds differently. All individual VFDs do not need to trip for the process to fail.
Why Synchronized VFD Processes Can Have a Narrower Tolerance
The presence of multiple VFDs does not automatically reduce the electrical sag tolerance of each individual drive. The issue is that more critical functions must survive the same disturbance at the same time.
A synchronized production process can have a narrower process-level ride-through envelope because all critical drives and control functions must remain coordinated.
The effective process tolerance is therefore often determined by its weakest critical function. That may be:
- a VFD;
- a motor axis;
- a PLC;
- a 24 V control supply;
- a contactor;
- a relay;
- a tension-control system.
EPRI and PG&E industrial guidance identify relays, contactors, control supplies and interlocking subsystems as possible weak links, separate from the individual drive itself.34
This is why protecting only the largest VFD does not necessarily protect the machine.
Why Textile Production Is a Good Example
Textile production often uses multiple drive-controlled functions that must operate together. Depending on the machine, these may include feeding, twisting, spindle operation, winding, take-up and tension control.
Suppose one axis loses torque or decelerates more rapidly during a sag while the others continue running. Even if most VFDs remain powered, the machine may lose:
- speed coordination;
- tension control;
- process sequence;
- product quality.
For these applications:
Voltage-sag tolerance should be evaluated at the production-process level, not only at the individual VFD level.
See why textile production lines are especially sensitive to voltage sags for the process-level weak-link and coordination problem.
See the broader application guidance for voltage-sag protection for textile production lines.
Field Example — Hangzhou Textile Application
At a textile manufacturing facility in Hangzhou, China, one Wilson PowerTech WS-300 protects a production area containing 16 two-for-one twisting machines.
The system has been operating since June 2025. Through August 27, 2026, site records show 18 recorded voltage-sag events, with successful ride-through in all 18 recorded events.
The protection objective is the production process as a whole, rather than treating each VFD as an isolated load. The verified scope and record cutoff are documented in the Hangzhou textile case study.
How Should VFD Sag Tolerance Be Determined?
Start with actual operating data.
| Parameter | Why it matters |
|---|---|
| Remaining AC voltage | Defines sag magnitude without percentage ambiguity |
| Sag duration | Defines how long support is required |
| Actual VFD load kW | Determines energy consumption |
| DC-bus voltage | Shows proximity to undervoltage |
| VFD fault code | Identifies the trip mechanism |
| Motor speed / process variable | Shows whether coordination is lost |
| PLC and control status | Reveals non-VFD weak links |
PG&E recommends recording actual sag magnitude and duration and providing the drive manufacturer with load information when determining the tolerance of a specific VFD and application.2
For critical production equipment, the most useful synchronized recording is:
AC voltage + AC current + DC-bus voltage + process response
during the same event. The result should ideally be expressed as a process ride-through envelope: remaining voltage versus duration, with the tested load and process boundary stated.
The Engineering Conclusion
There is no universal answer to How deep a voltage sag can a VFD ride through?
The answer depends on how low the remaining voltage is + how long it remains there + how heavily loaded the VFD is + how much DC-link energy is usable + what the process must continue doing.
For a stand-alone pump or fan, temporary speed reduction may be acceptable. For a synchronized textile, paper, coating, winding or extrusion process, it may not be.
The most important distinction is:
VFD ride-through is an equipment question. Process ride-through is a production question.
Frequently Asked Questions
Can a VFD ride through a sag to 70% of nominal voltage?
There is no universal answer. Duration, actual load, DC-link energy, undervoltage threshold and drive control strategy all affect the result.
Are larger VFDs more sensitive to voltage sags?
Not automatically. A more useful metric is usable DC-link energy relative to actual load power.
Are multiple synchronized VFDs more sensitive than one VFD?
The individual drives are not automatically more electrically sensitive. However, the complete process often has a narrower tolerance because all critical axes and control functions must remain coordinated.
Related Reading
- How much energy a VFD needs for voltage-sag ride-through
- Why a VFD trips during a voltage sag
- Voltage-sag protection for textile production lines
Technical References
- Electric Power Research Institute, Chapter 9: Adjustable-Speed Drive Technology and Power Quality Considerations. PQ Encyclopedia. Accessed August 31, 2026.
- Pacific Gas and Electric Company, Methods for Mitigating Voltage Sag Impact on Variable-Frequency Drives. Revised July 2018. Accessed August 31, 2026.
- Electric Power Research Institute, Making Equipment Immune to Voltage Sags: What You Need to Know about Standards and Voltage-Sag Testing Methods. March 2007. Accessed August 31, 2026.
- Pacific Gas and Electric Company, Voltage Sag Ride-through Mitigation in Sequence by Increasing Cost. July 2018. Accessed August 31, 2026.